The Art of Climate Change Collection
The collection is organized into five galleries, each offering a unique lens on climate change.
The “WHY?” Series explores why our climate is changing, while the “HOW?” Series illustrates its impact on our world. The “WHO?” Series highlights the people and communities most at risk, and the “WHAT?” Series considers the actions we can take to address the crisis. Finally, the “No-Graph-Iti?” Series uses words, numbers, and other concepts to deepen our understanding of climate science.

Modeling Climate Change - Scenario CMIP7

How the Countries of the World are Generating Electricity

Arctic Sea Ice Extent - 1500 Years

Managing Rising Aridity
How close are we to tipping over?

The Wasted Food Scale
The Air We Breathe
Demand for Electricity in U.S. is Growing
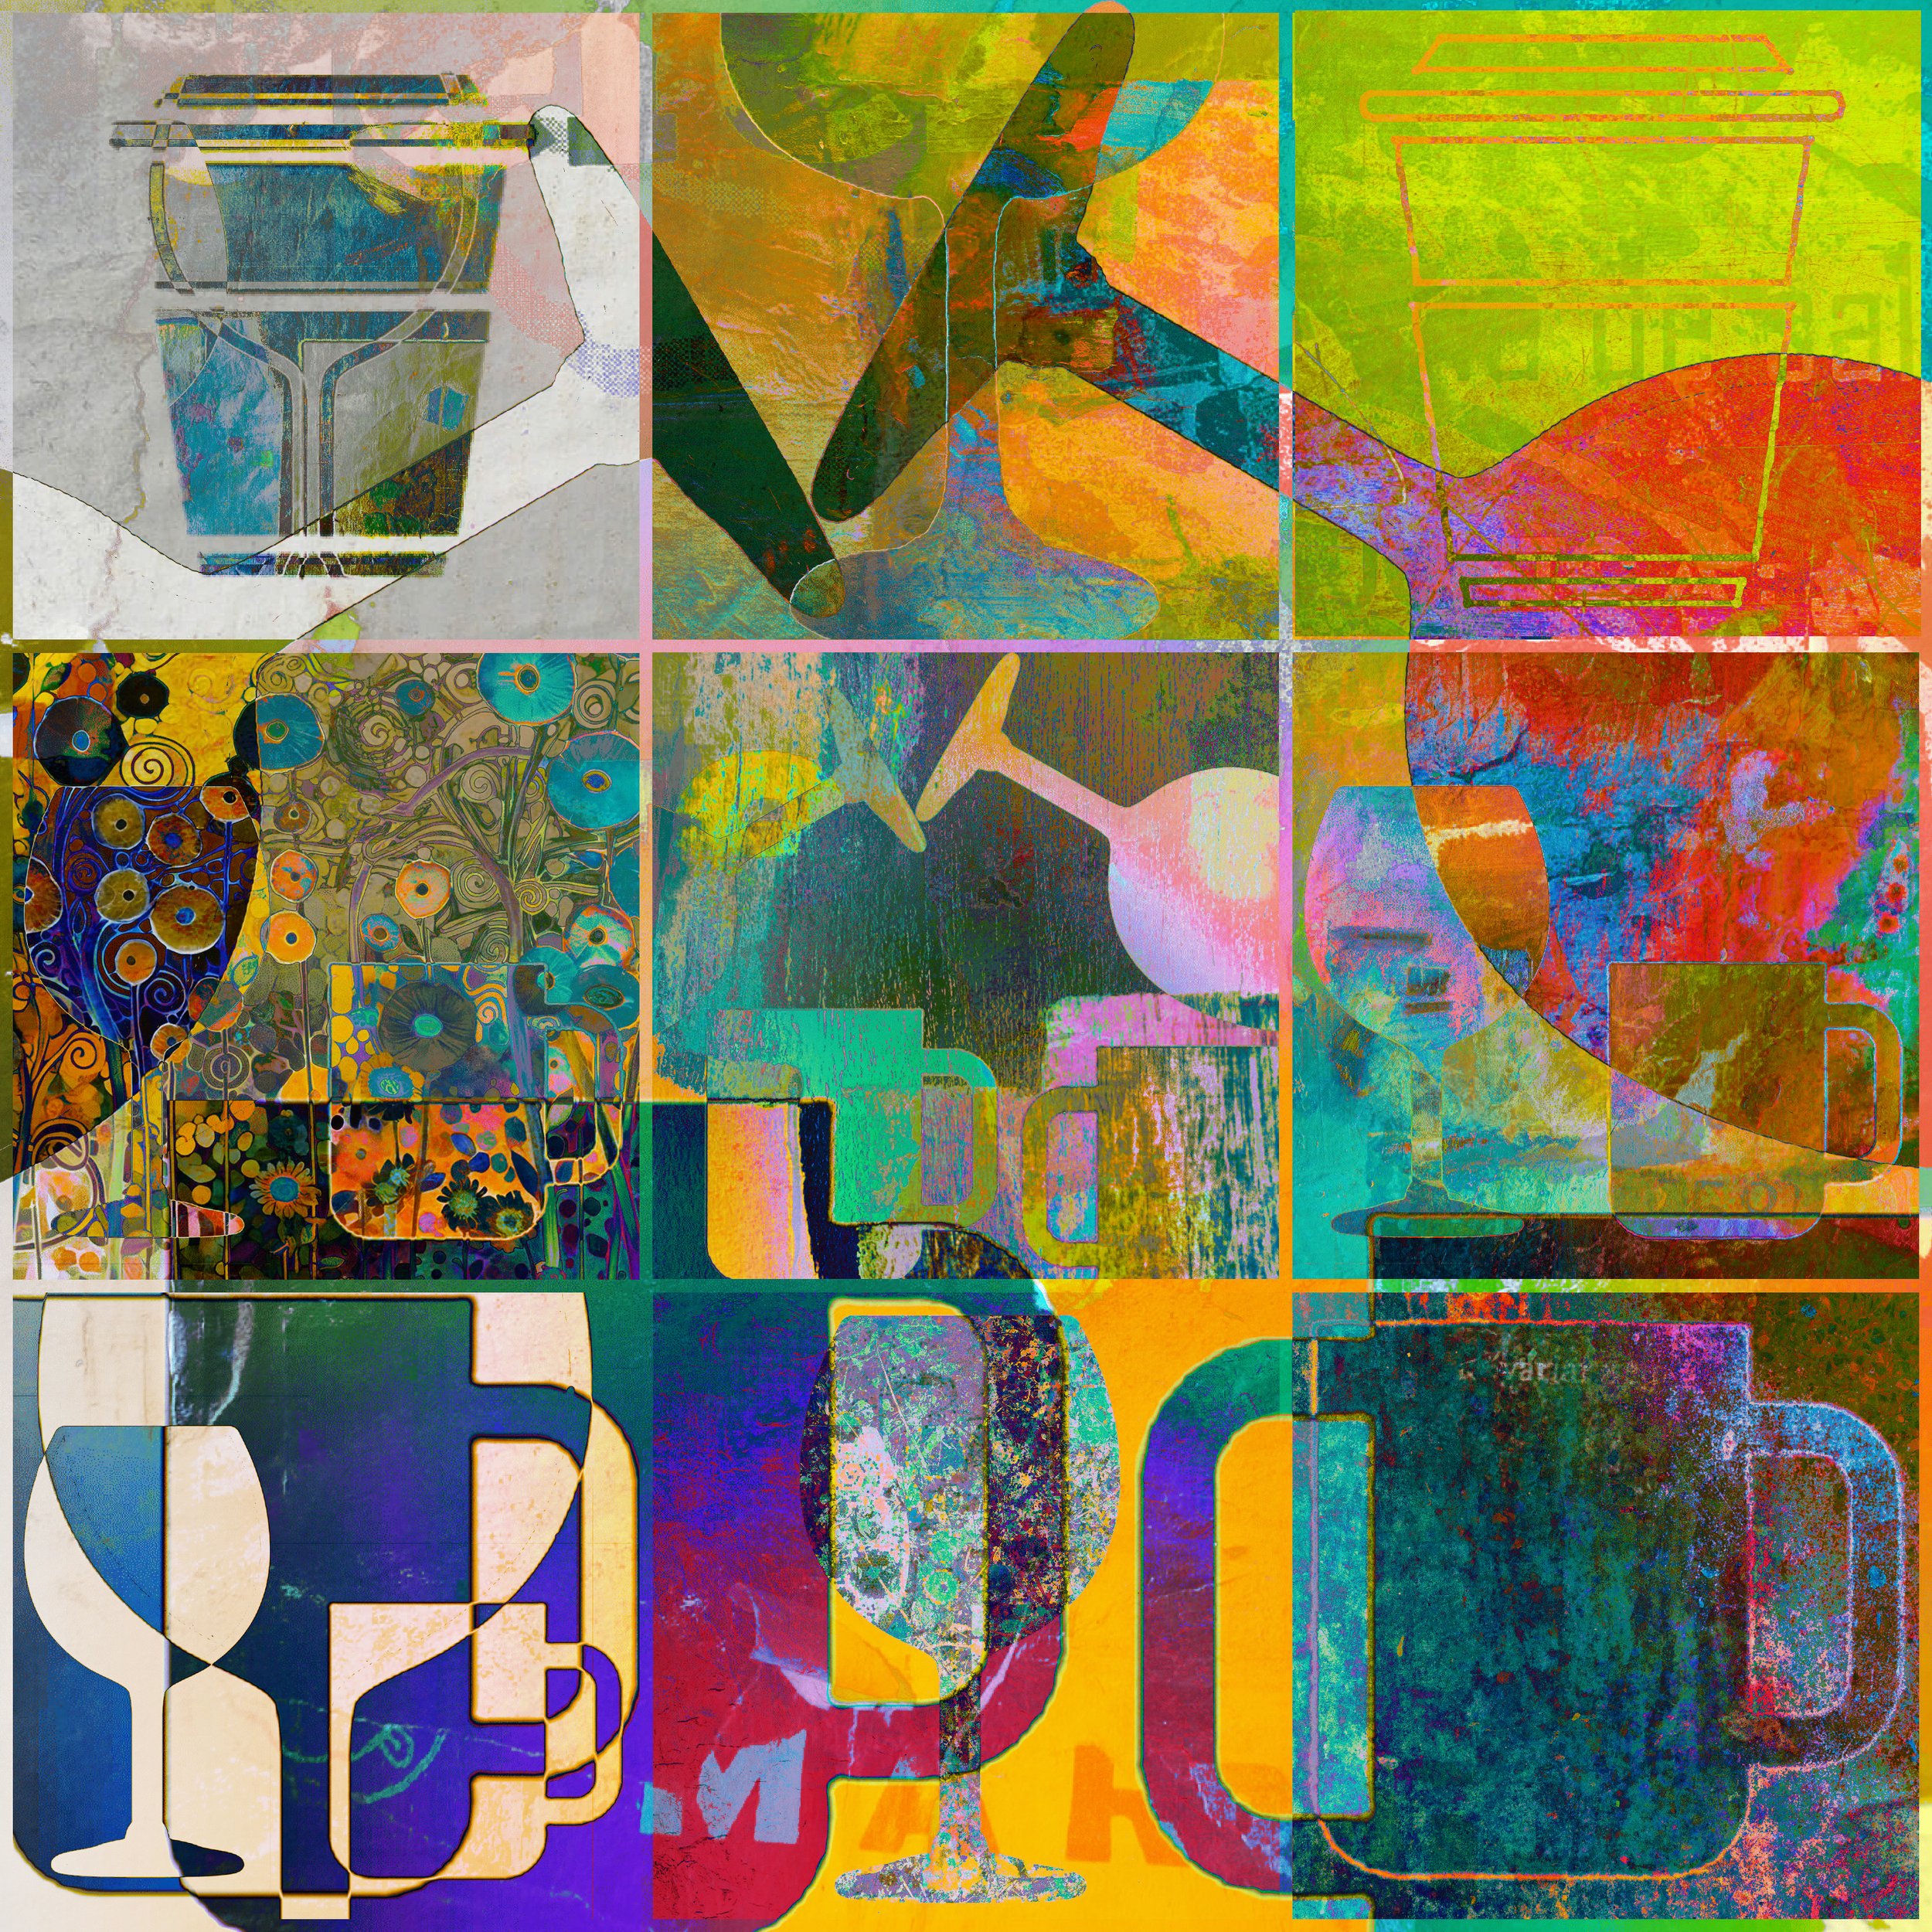
Climate Change and Our Favorite Beverages

Indoor Summers

Insurance Costs are Rising
Homeless
Changes in Electricity Generation in the US
Choice of Protein Impacts GHG Emissions
Increasing Battery Storage Capacity
Many Records Broken
Keeling Curve - C02 Emissions 1958-2021

Wind Electricity is Trending Up Significantly

Record Breaking Heat

Nations’ Greenhouse Gas Emissions - Past and Current
2° C (3.6°F) - What does it mean?
Temperature and CO2 for Last 1000 Years
Deforestation and Climate Change
Scenarios for Reducing Emissions

Human-Induced Methane Emissions - Future Scenarios
Top Ten Emitters of GHGs - Global and U.S.
Changes in US Temperature By Region
Global Carbon Emissions by Source

Global Actions and Pledges Not Enough
Global Temperatures 1880-2019

Wealth and Carbon Footprint
Relationship between Emissions Levels and Temperature Rise
Radiative Forcing
Sources and Sinks
Greenhouse Gas Index

Transportation - Biggest U.S. Emitter
Pathways for Reducing Emissions
Global Seasonal Temperature Cycles
Heat
Antarctica Ice Melt
Wildfires and Climate Change

Historical and Projected Global Sea Level Rise
Arctic Sea Ice Extent 1979-2017
Greenhouse Gas Emissions By Sector
Coal Demand
Trends in Global Methane Emissions