The Art of Climate Change Collection
The collection is organized into five galleries, each offering a unique lens on climate change.
The “WHY?” Series explores why our climate is changing, while the “HOW?” Series illustrates its impact on our world. The “WHO?” Series highlights the people and communities most at risk, and the “WHAT?” Series considers the actions we can take to address the crisis. Finally, the “No-Graph-Iti?” Series uses words, numbers, and other concepts to deepen our understanding of climate science.
Modeling Climate Change - Scenario CMIP7
350 Species at Risk from Climate Change

Mortality Risks - Hazards by Regions
Trends in Great Lakes Temperature Extremes

World Weather Attribution - When is Climate Change to Blame?

Arctic Sea Ice Extent - 1500 Years
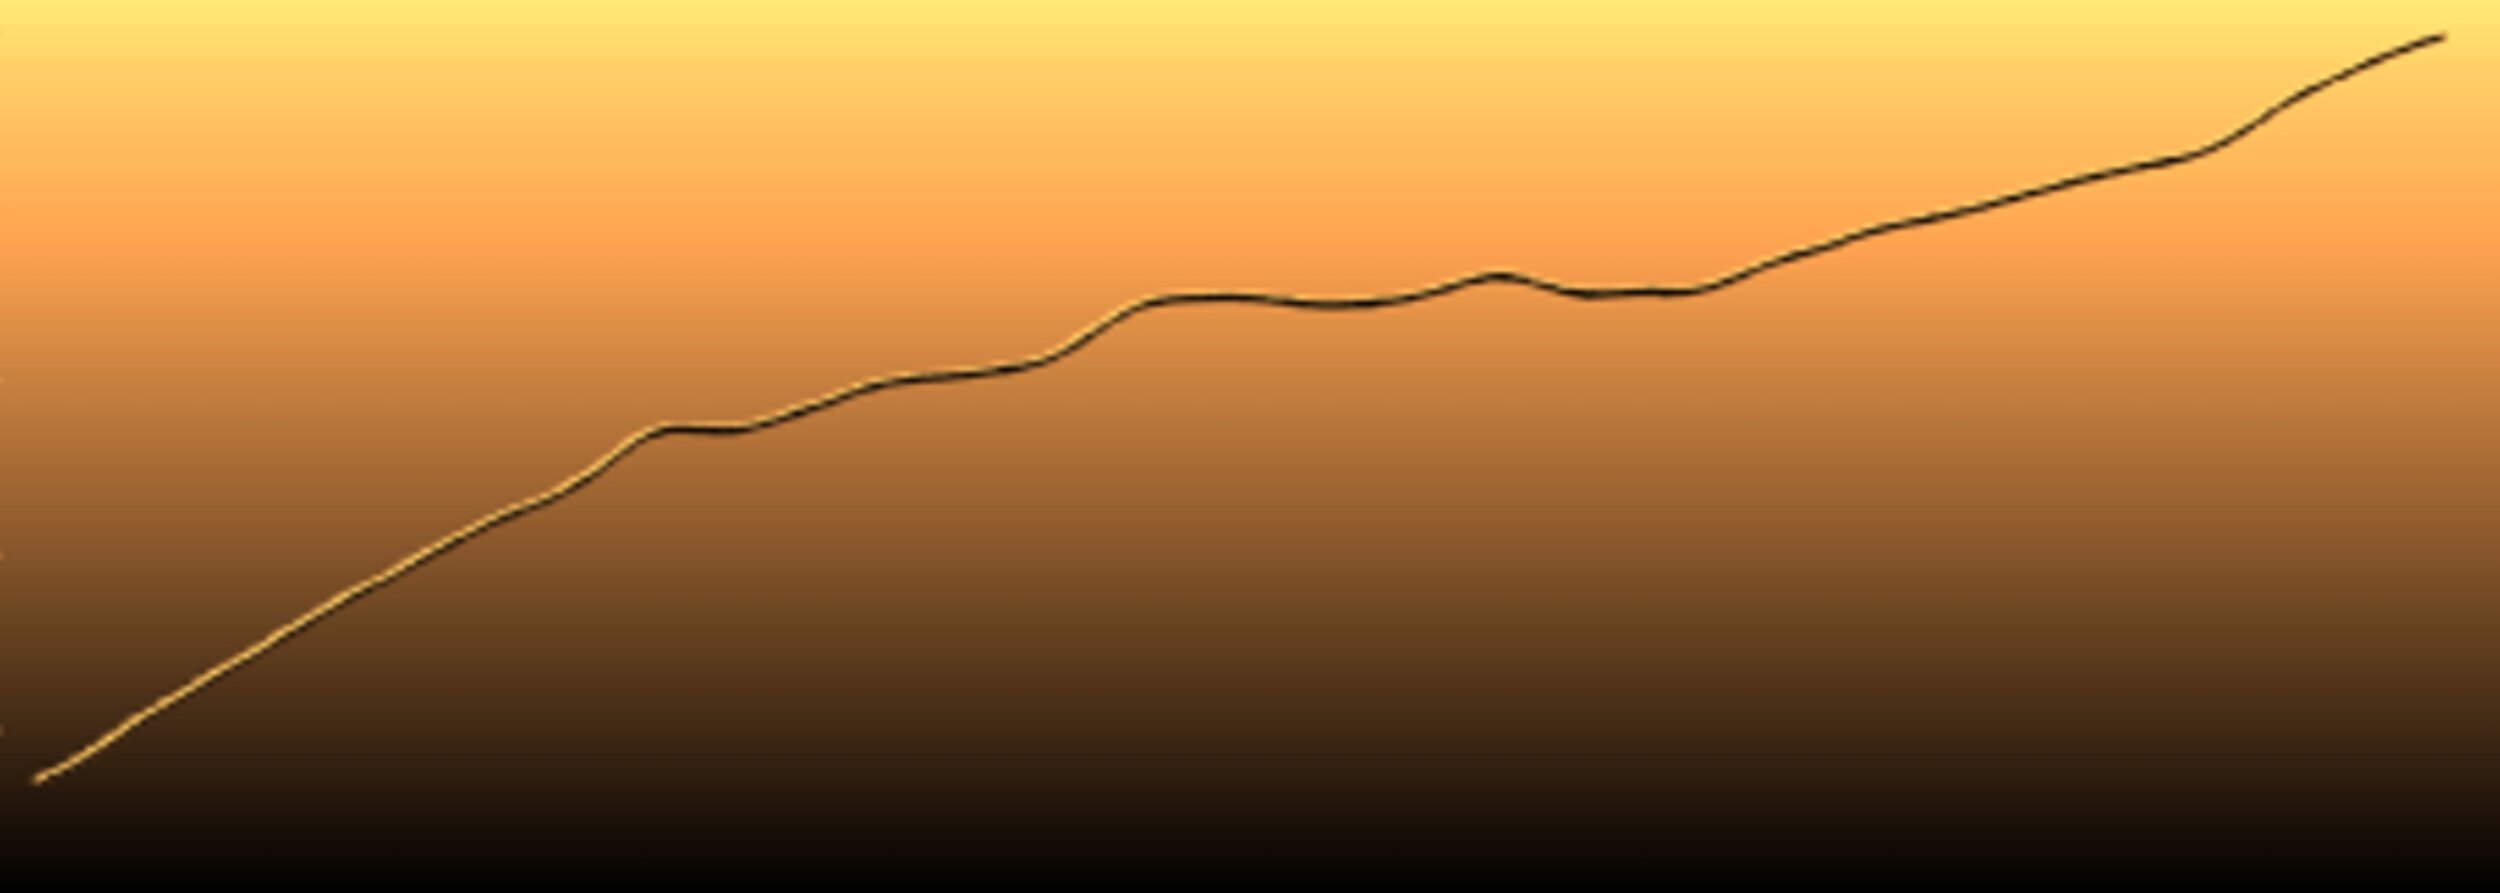
Demand for Electricity in U.S. is Growing
Choice of Protein Impacts GHG Emissions
Many Records Broken
Keeling Curve - C02 Emissions 1958-2021

Record Breaking Heat

Nations’ Greenhouse Gas Emissions - Past and Current
Temperature and CO2 for Last 1000 Years
Deforestation and Climate Change
Human-Induced Methane Emissions - Future Scenarios
Top Ten Emitters of GHGs - Global and U.S.
Arctic Amplification
Methane Leaks - Seeking Accurate Reports
Global Carbon Emissions by Source
Global Temperatures 1880-2019
Relationship between Emissions Levels and Temperature Rise
Radiative Forcing
Breakdown of US Transportation GHG Emissions
Weakening Atlantic Ocean Currents
Global Warming - Man or Nature?
Sources and Sinks
Greenhouse Gas Index

Transportation - Biggest U.S. Emitter
Greenhouse Gas Emissions By Sector

Population Growth
Coal Demand