The Art of Climate Change Collection
The collection is organized into five galleries, each offering a unique lens on climate change.
The “WHY?” Series explores why our climate is changing, while the “HOW?” Series illustrates its impact on our world. The “WHO?” Series highlights the people and communities most at risk, and the “WHAT?” Series considers the actions we can take to address the crisis. Finally, the “No-Graph-Iti?” Series uses words, numbers, and other concepts to deepen our understanding of climate science.
How close are we to tipping over?
Arctic and Antarctic Daily Sea Ice Extent
Wildfire trends in the U.S.
Hotter Nights
Drought - Past and Projected Global Impacts on Area and Population
Damages from Floods are Increasing
100 Year Events and Sea Level Rise
Antarctica Ice Shelves - Loss and Instability
Antarctica Sea Ice Trends 1981-2023
Changes in US Temperature By Region
Multiple Impacts to Oceans and Ice Sheets from Global Warming
Ocean Heat
High-Tide Flooding
Increases in U.S. Precipitation
Billion-Dollar Natural Disaster Event Frequency - US
Hotter Summers
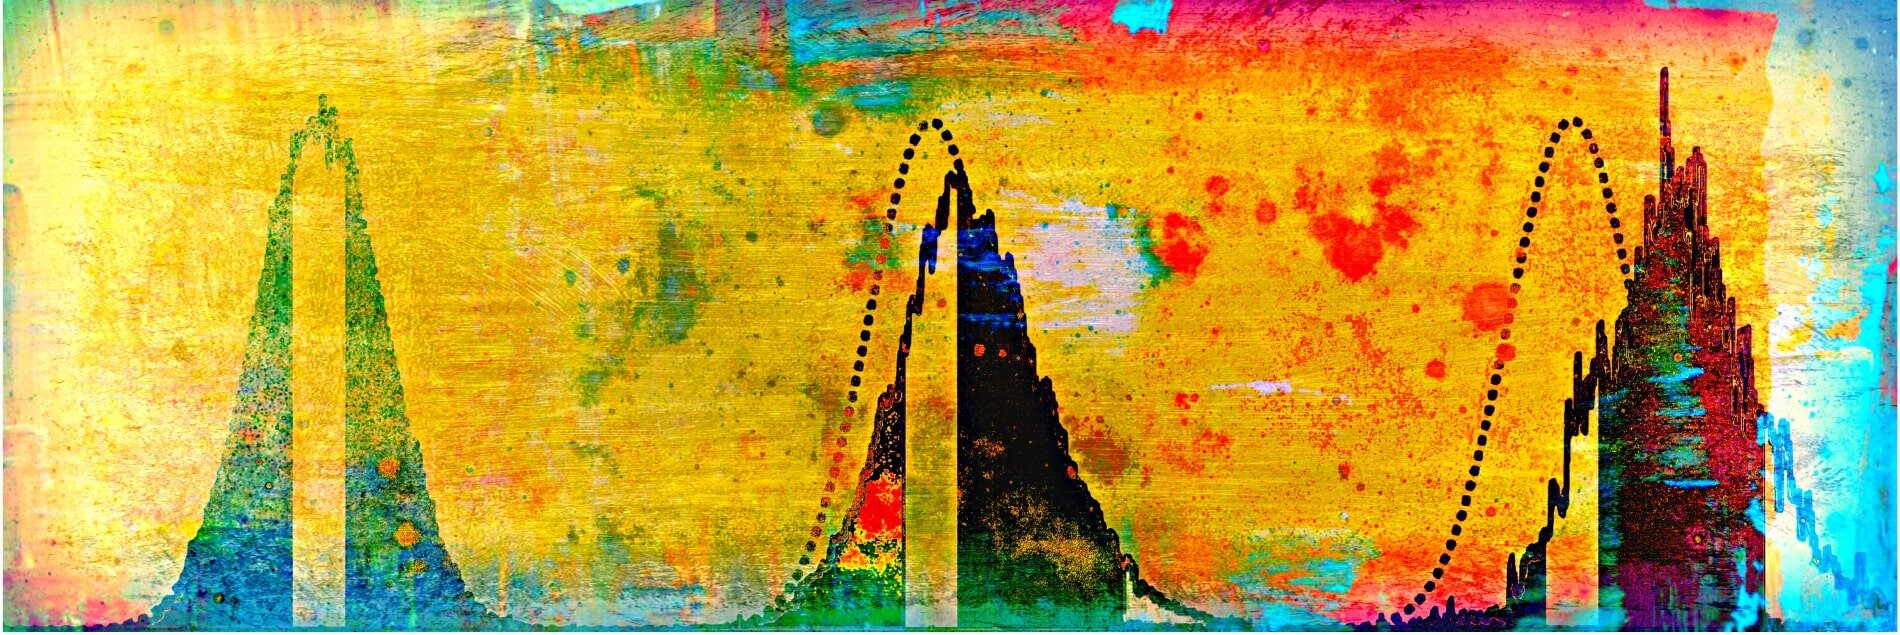
Global Seasonal Temperature Cycles
Great Lakes Ice Cover Decline
Antarctica Ice Melt
Drought
Wildfires and Climate Change
Global Tipping Points
Historical and Projected Global Sea Level Rise
Arctic Sea Ice Extent 1979-2017